Each page shown at full size on click, with notes on what it contains and why it matters in diligence.
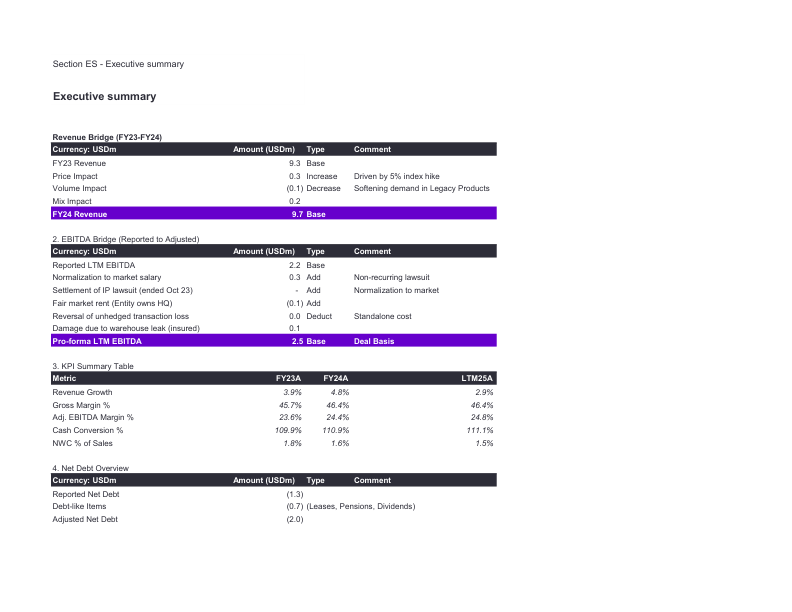
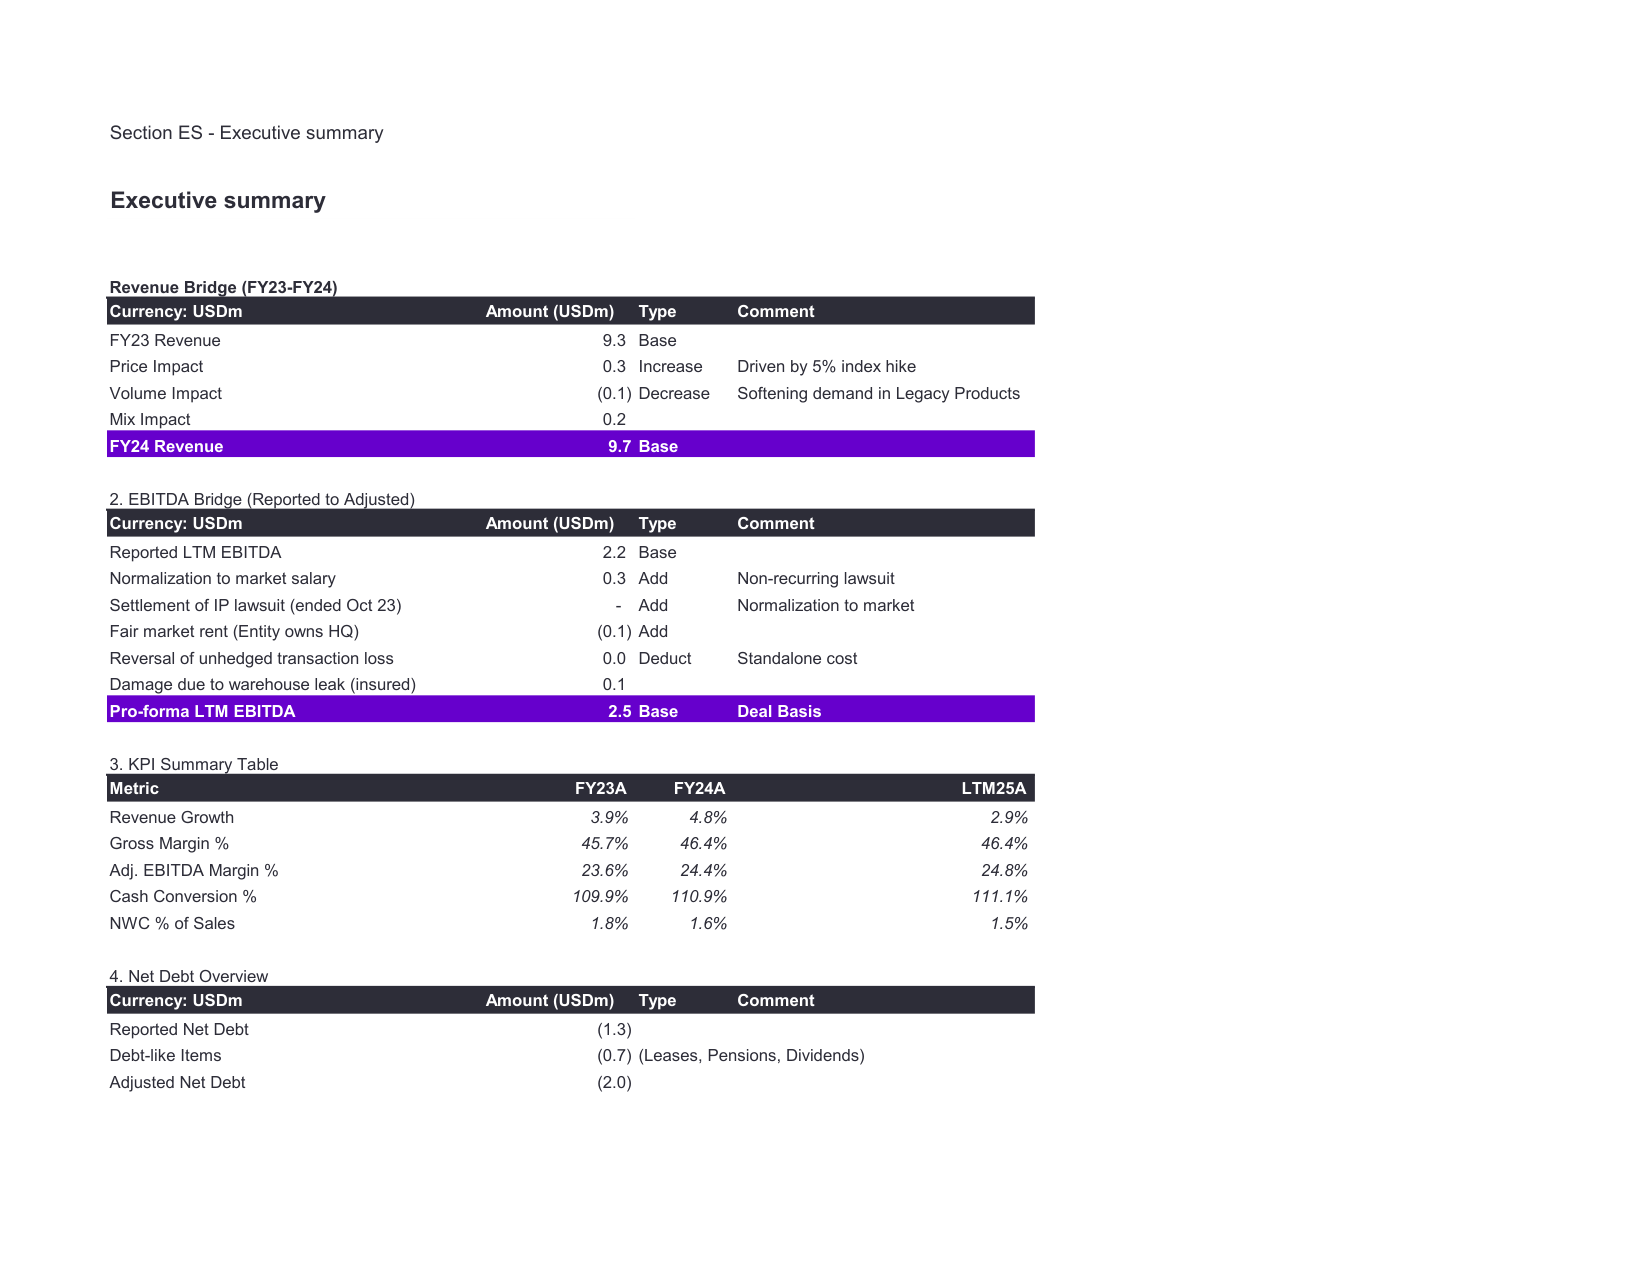
Page 2 · ES — Executive summary — click to enlarge
Executive summary
One page a partner or investment committee can read in two minutes: what moved revenue, what moved EBITDA, and what the balance sheet really looks like.
- Revenue bridge FY23 → FY24 split into price, volume and mix — with the commentary attached (“5% index hike”, “softening demand in legacy products”)
- EBITDA bridge from reported to pro-forma, each adjustment named and typed as add or deduct
- KPI table — revenue growth, gross margin, adjusted EBITDA margin, cash conversion, NWC as % of sales
- Net debt overview separating reported net debt from debt-like items
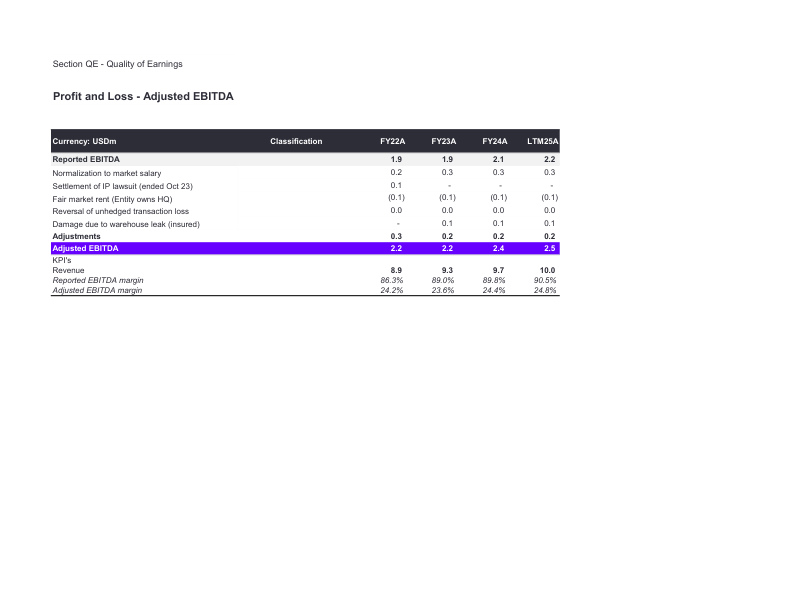
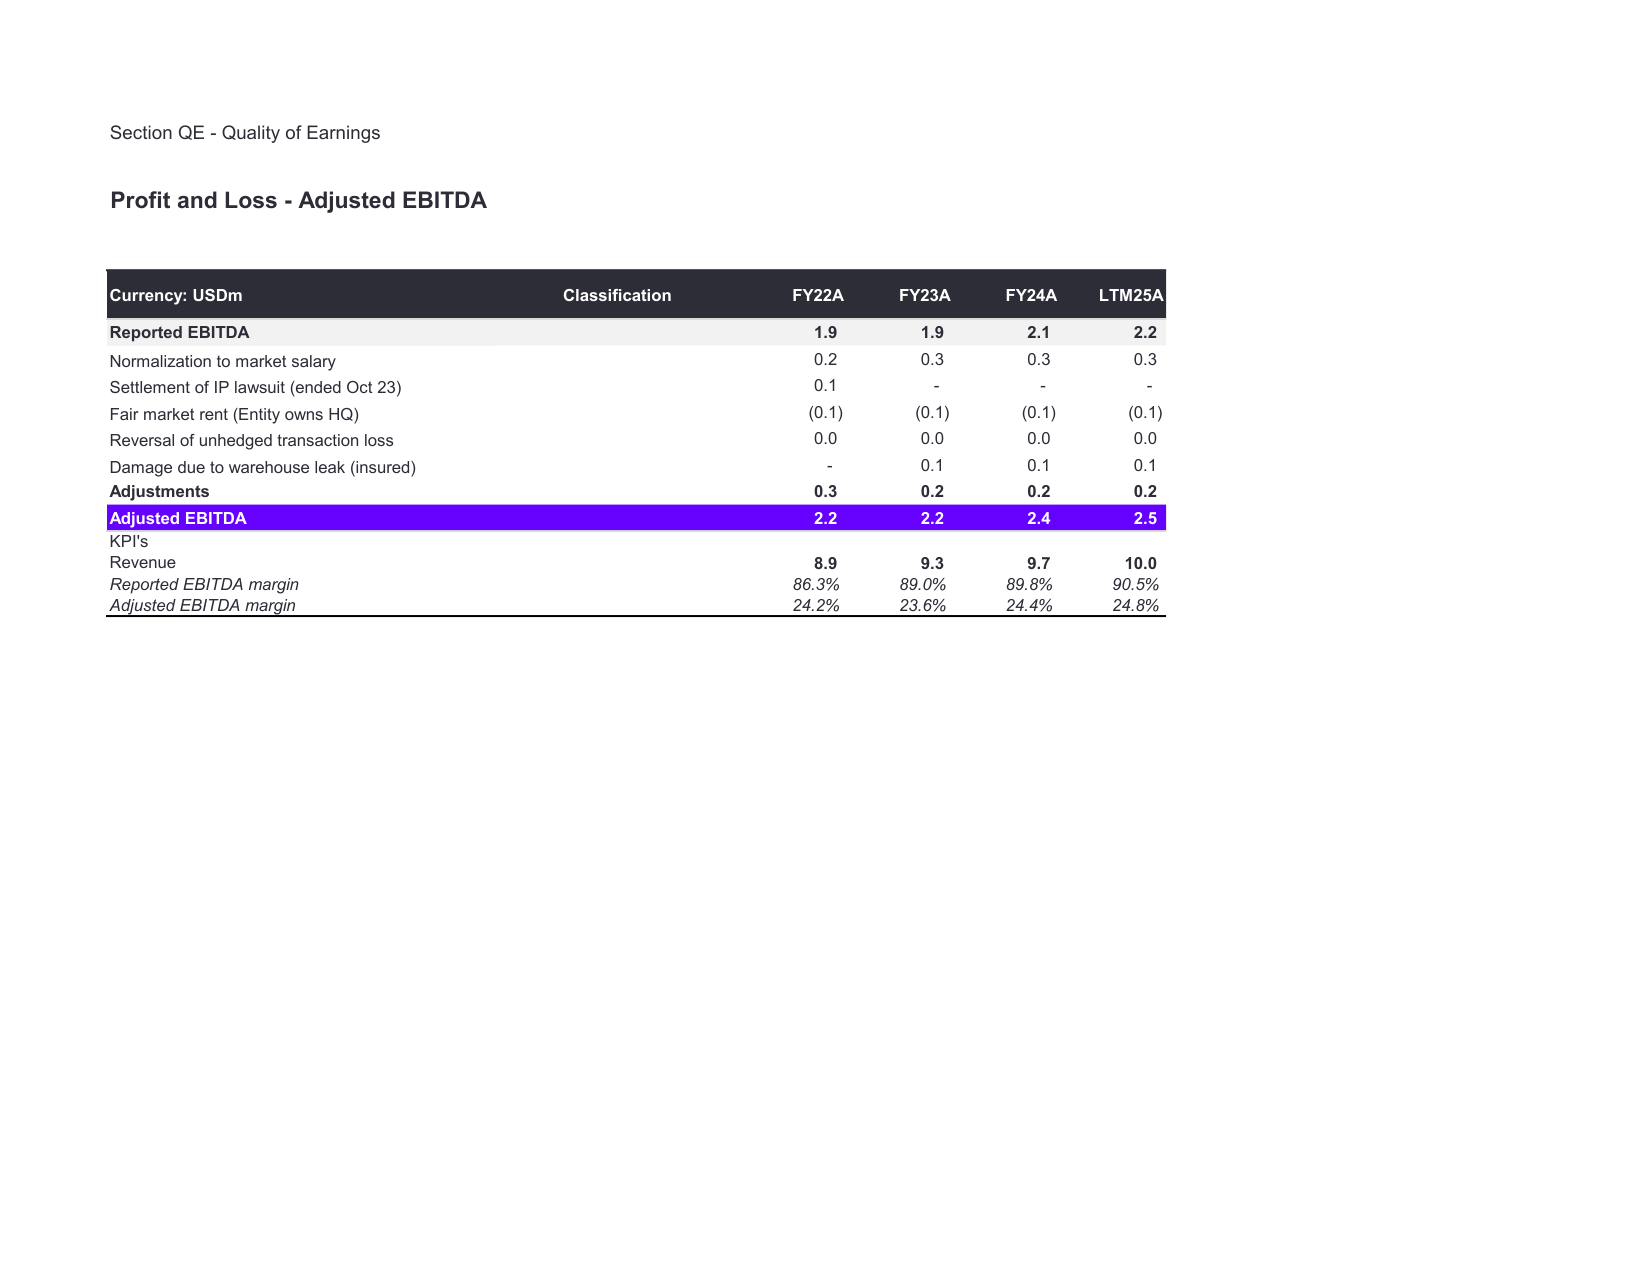
Page 3 · QE — Quality of earnings — click to enlarge
Adjusted EBITDA bridge
The heart of a quality of earnings exercise: reported EBITDA walked to a defensible deal basis, with every adjustment supported rather than asserted.
- Reported EBITDA across FY22A, FY23A, FY24A and LTM25A — four periods, so trend is visible
- Owner salary normalised to market — the most common owner-led adjustment
- Fair market rent where the entity owns its own premises — note this one is a deduction, not an add-back. Buyers reject packs that only adjust upward
- Non-recurring items — an IP lawsuit settlement that ended in Oct-23, and insured warehouse leak damage — each dated so a buyer can test whether it truly does not recur
- Adjusted EBITDA margin carried through to show the effect on the multiple
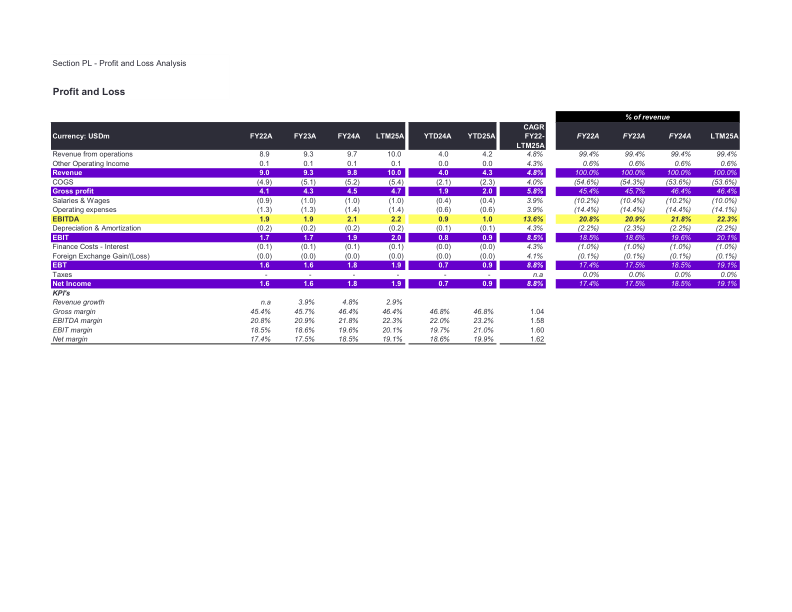
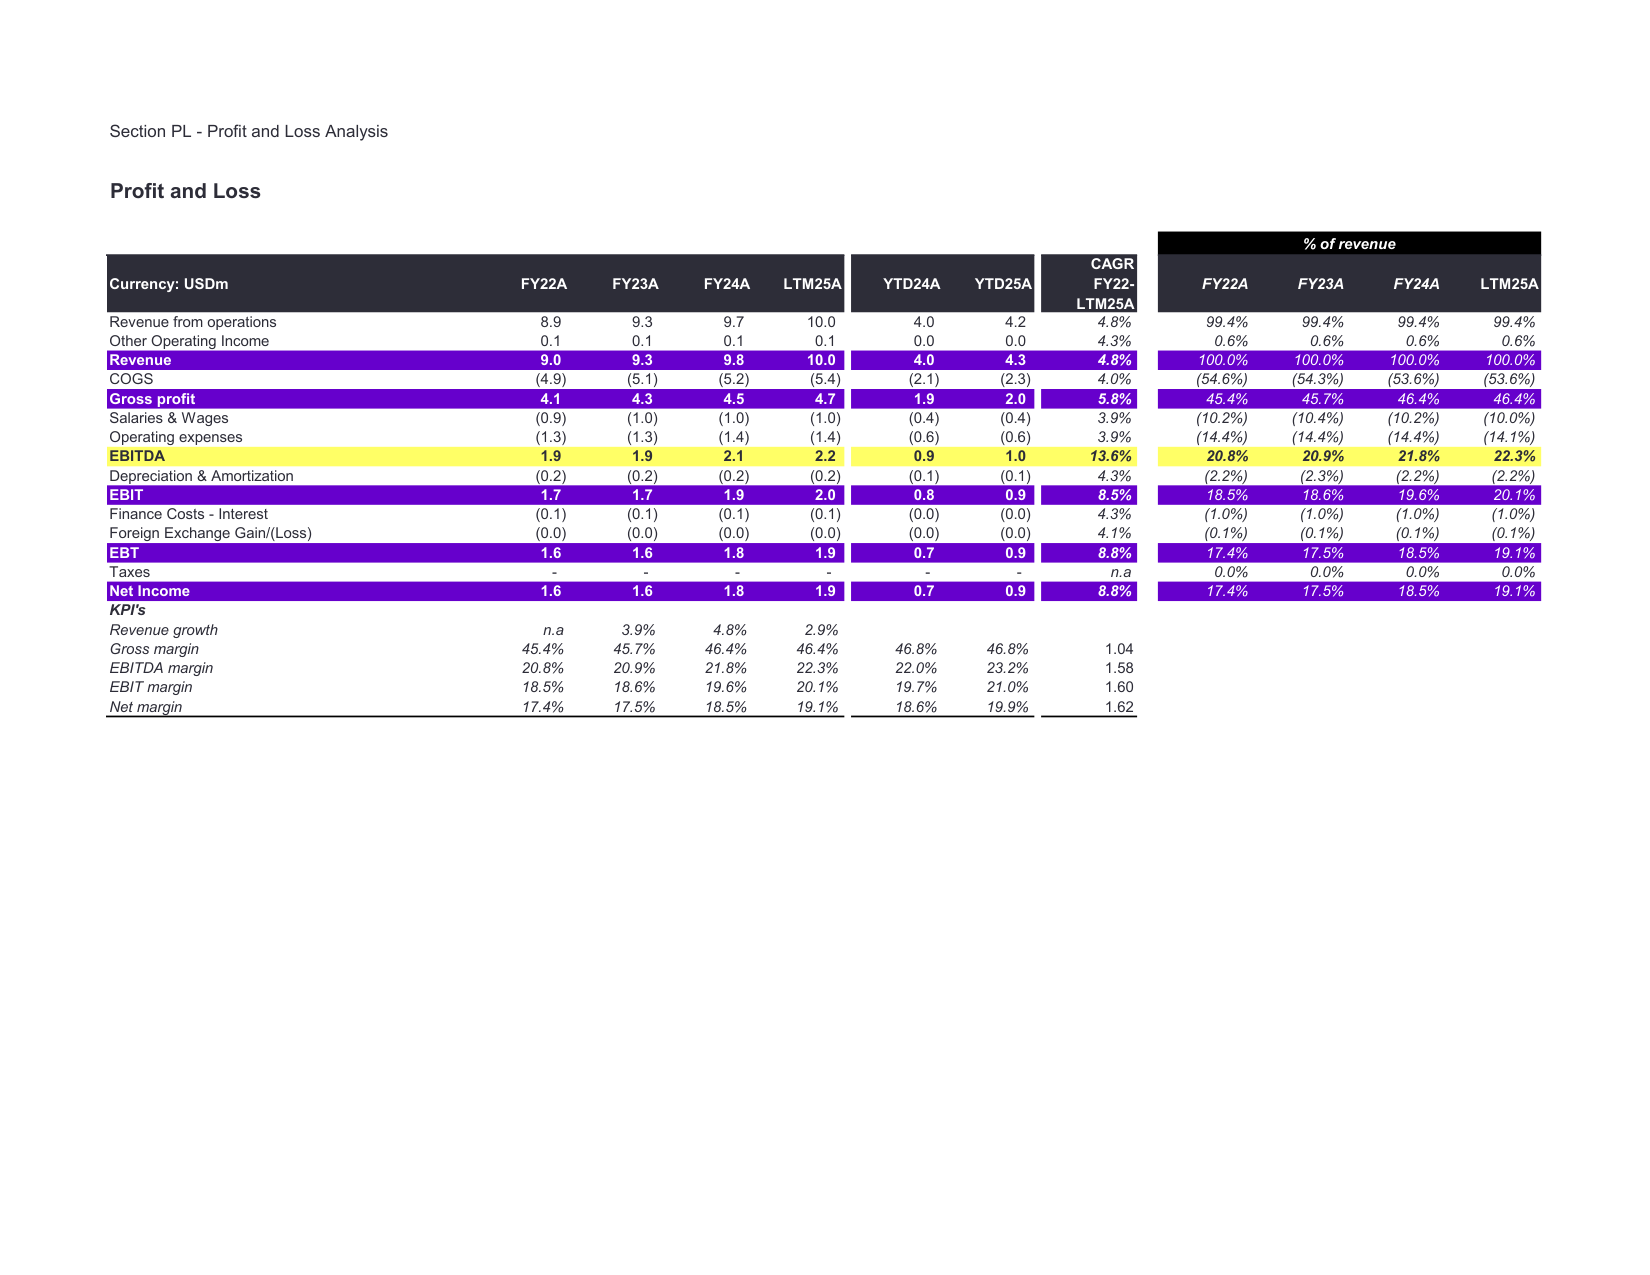
Page 10 · PL — Profit and loss — click to enlarge
Profit and loss detail
The full P&L at account level, with every period a buyer will ask for lined up side by side.
- Account-code level line items, not summarised categories
- FY22A through LTM25A, plus YTD24A and YTD25A for current-year comparison
- % of revenue column alongside absolute figures
- CAGR FY22–LTM25A per line, so cost creep is visible rather than buried
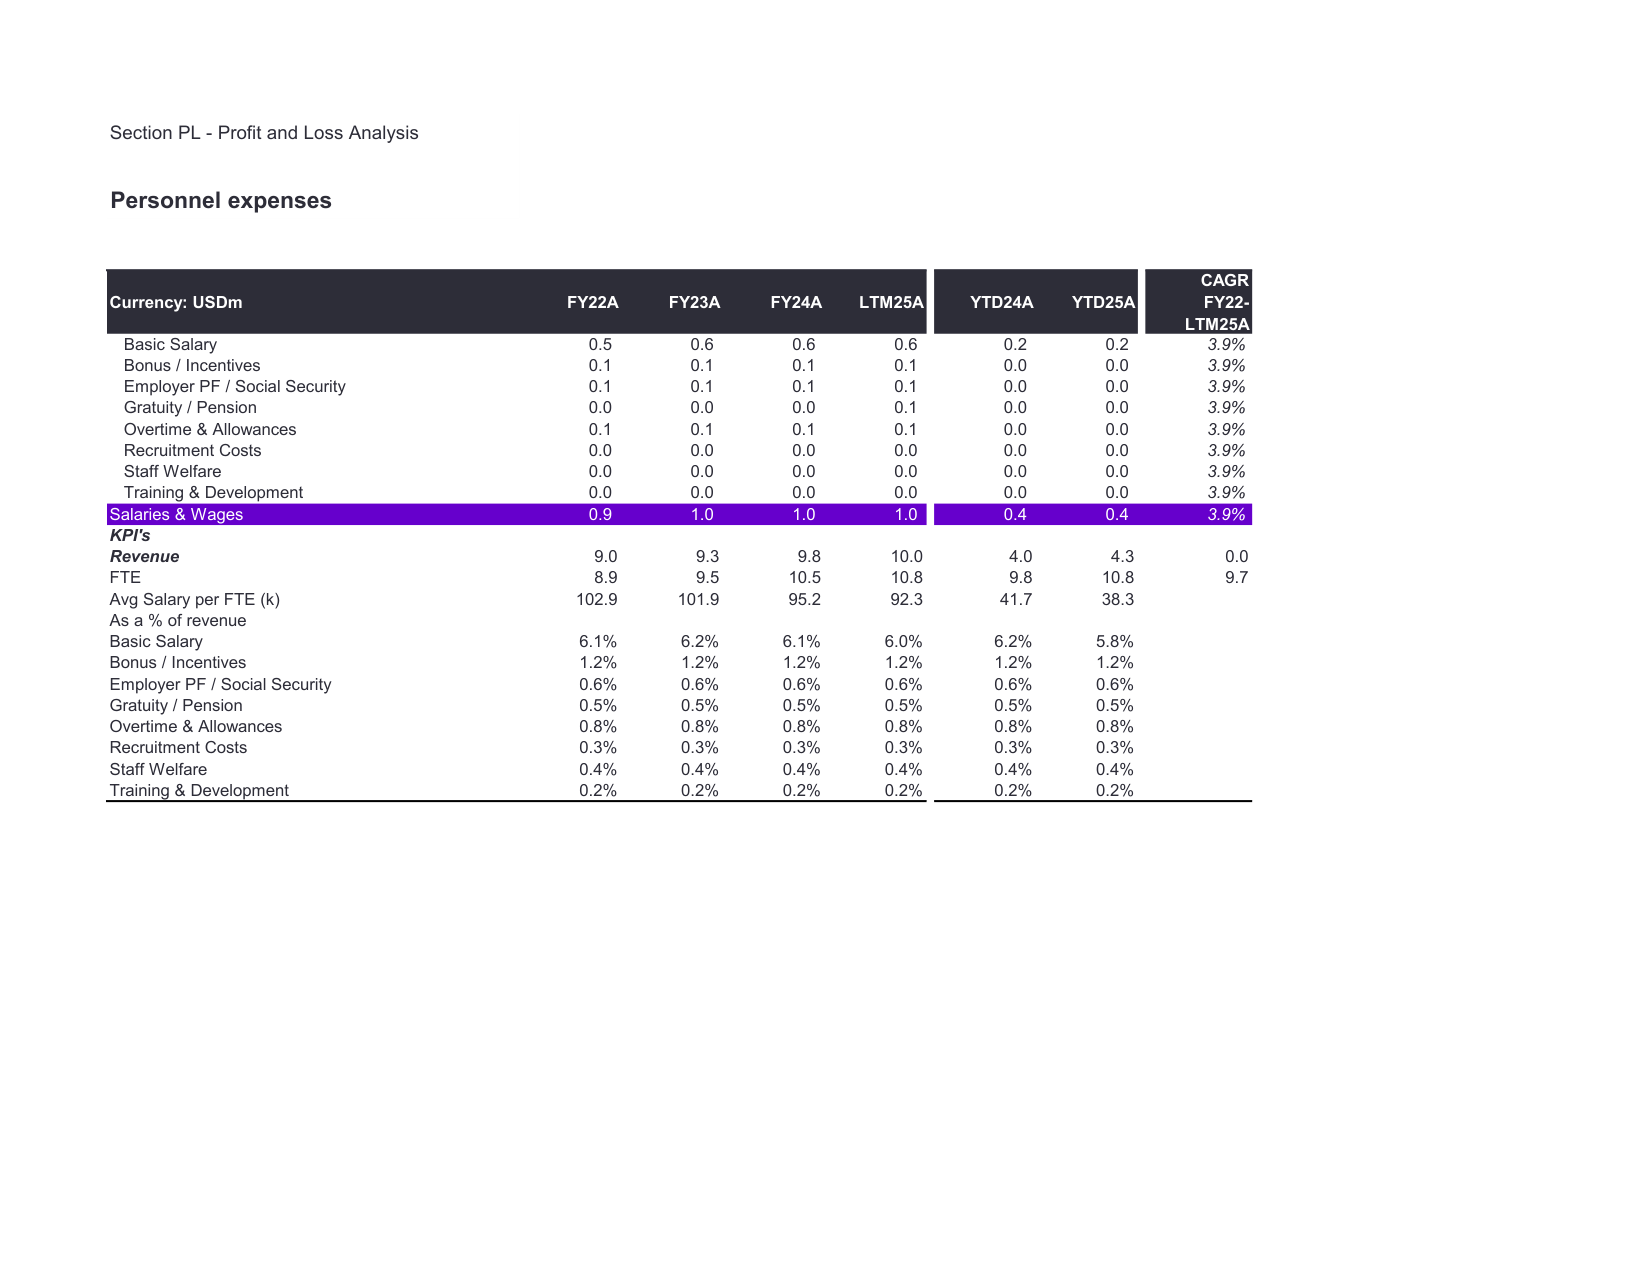
Page 11 · PL — Profit and loss — click to enlarge
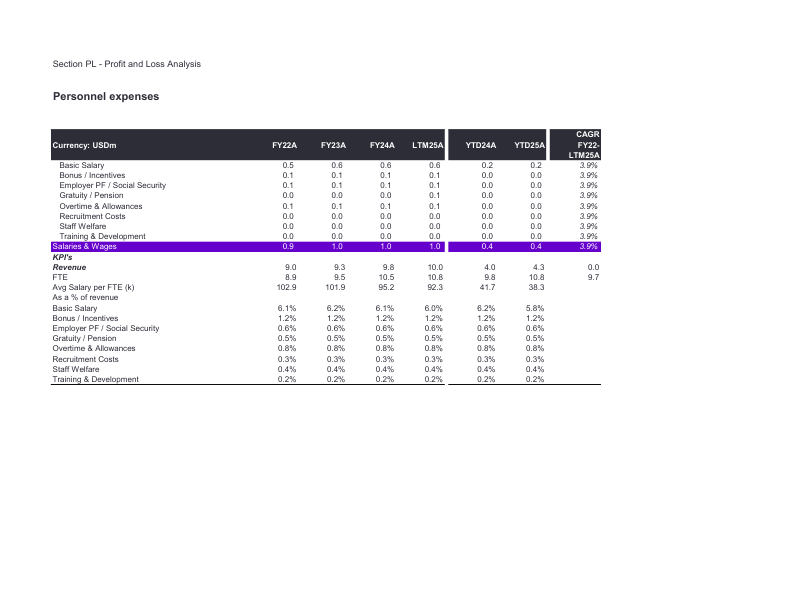
Personnel expenses & FTE
Payroll broken into its components and tied to headcount — usually the largest cost line and the one most often mis-stated in owner-led businesses.
- Basic salary, bonus, social security, gratuity, overtime, recruitment, welfare and training split out
- FTE count by period alongside cost
- Average salary per FTE derived — showing whether cost growth is rate or headcount
- Ties directly into the market-salary normalisation shown in the quality of earnings section
Page 13 · PL — Profit and loss — click to enlarge
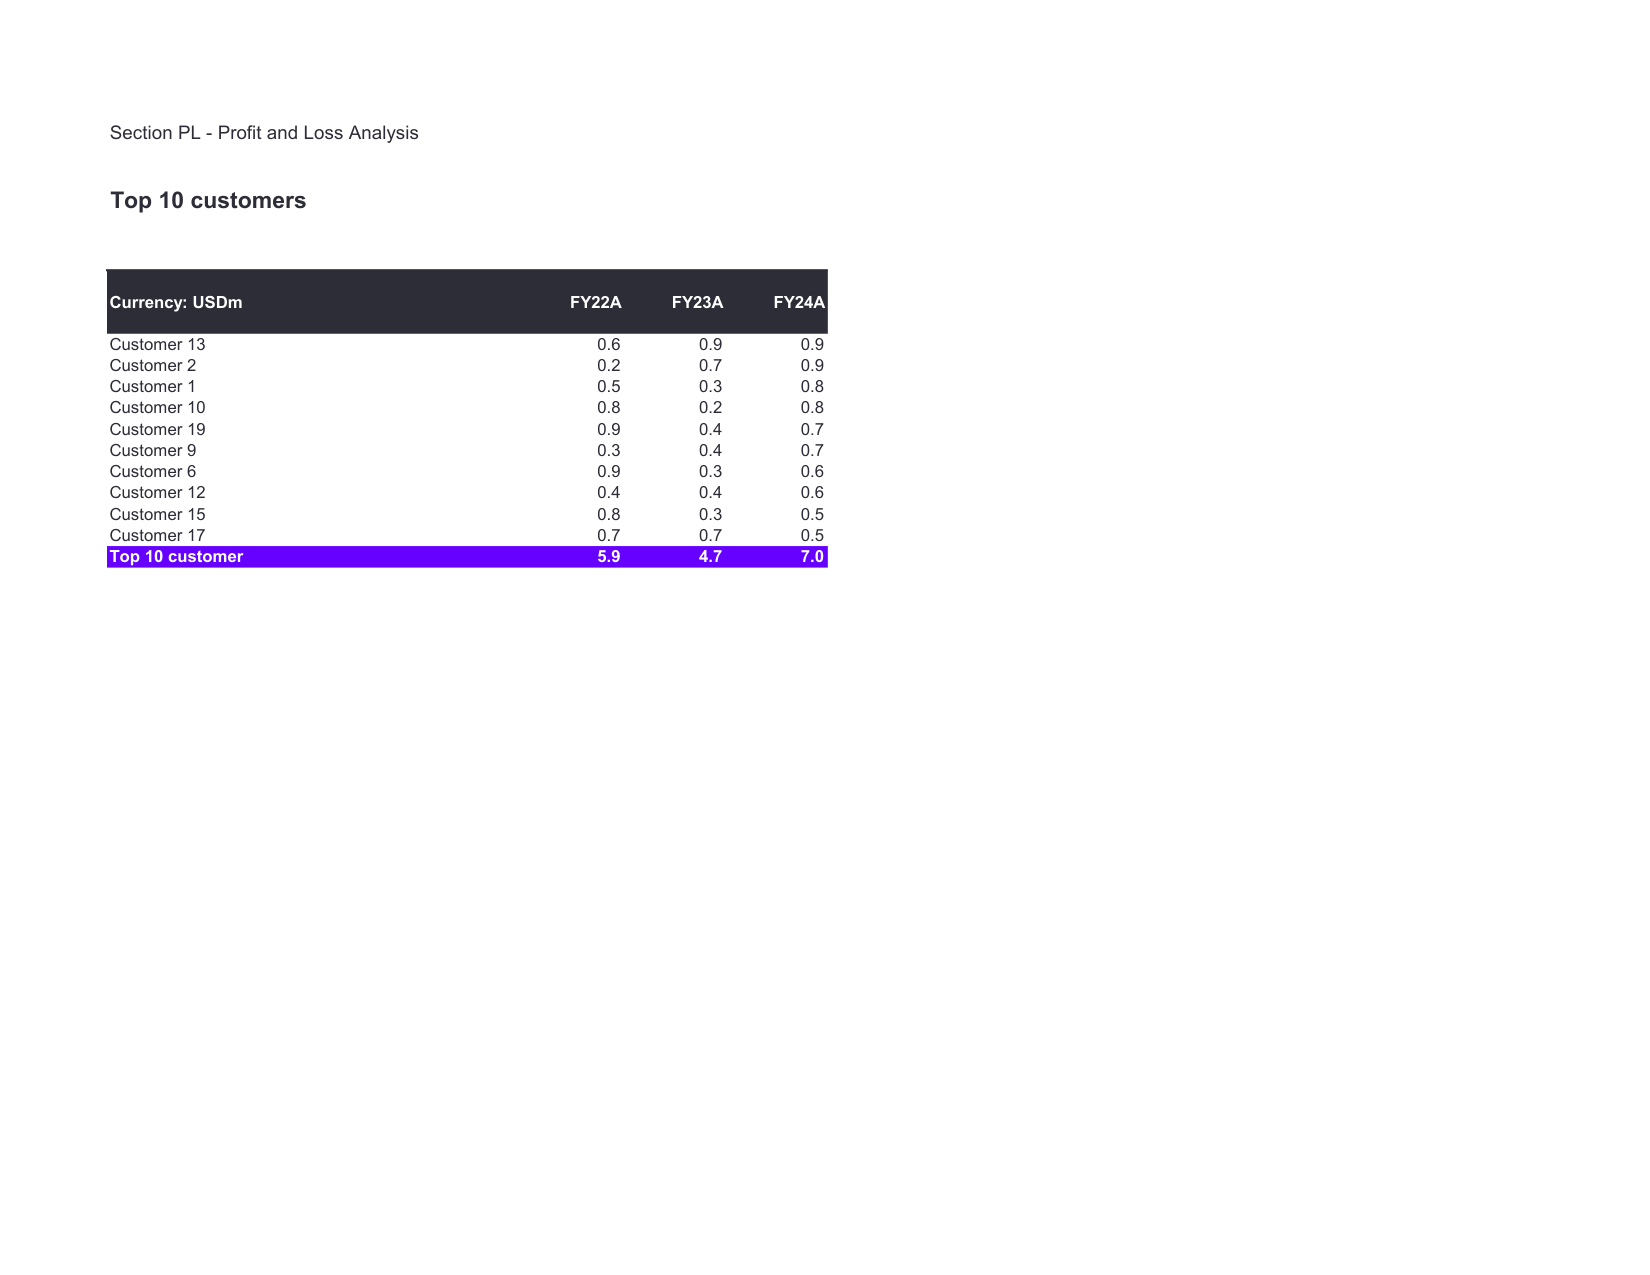
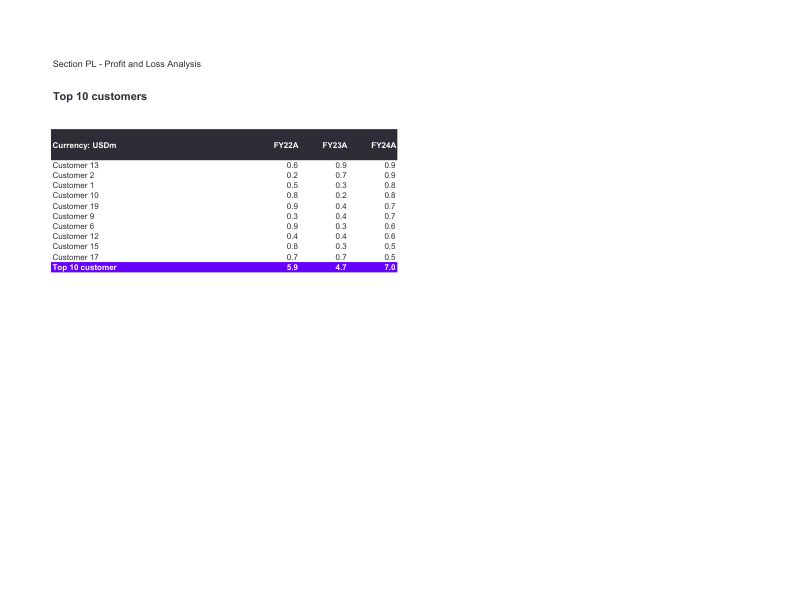
Top 10 customer concentration
Who the revenue actually comes from, and how stable that has been. Concentration risk is one of the first things a buyer prices.
- Top 10 customers by revenue across FY22A, FY23A and FY24A
- Year-on-year movement per customer — churn and recovery both visible
- Top 10 as a share of total revenue
- Customers anonymised by reference in the working file, so the analysis can be shared before NDA-covered detail is
Page 18 · BS — Balance sheet — click to enlarge
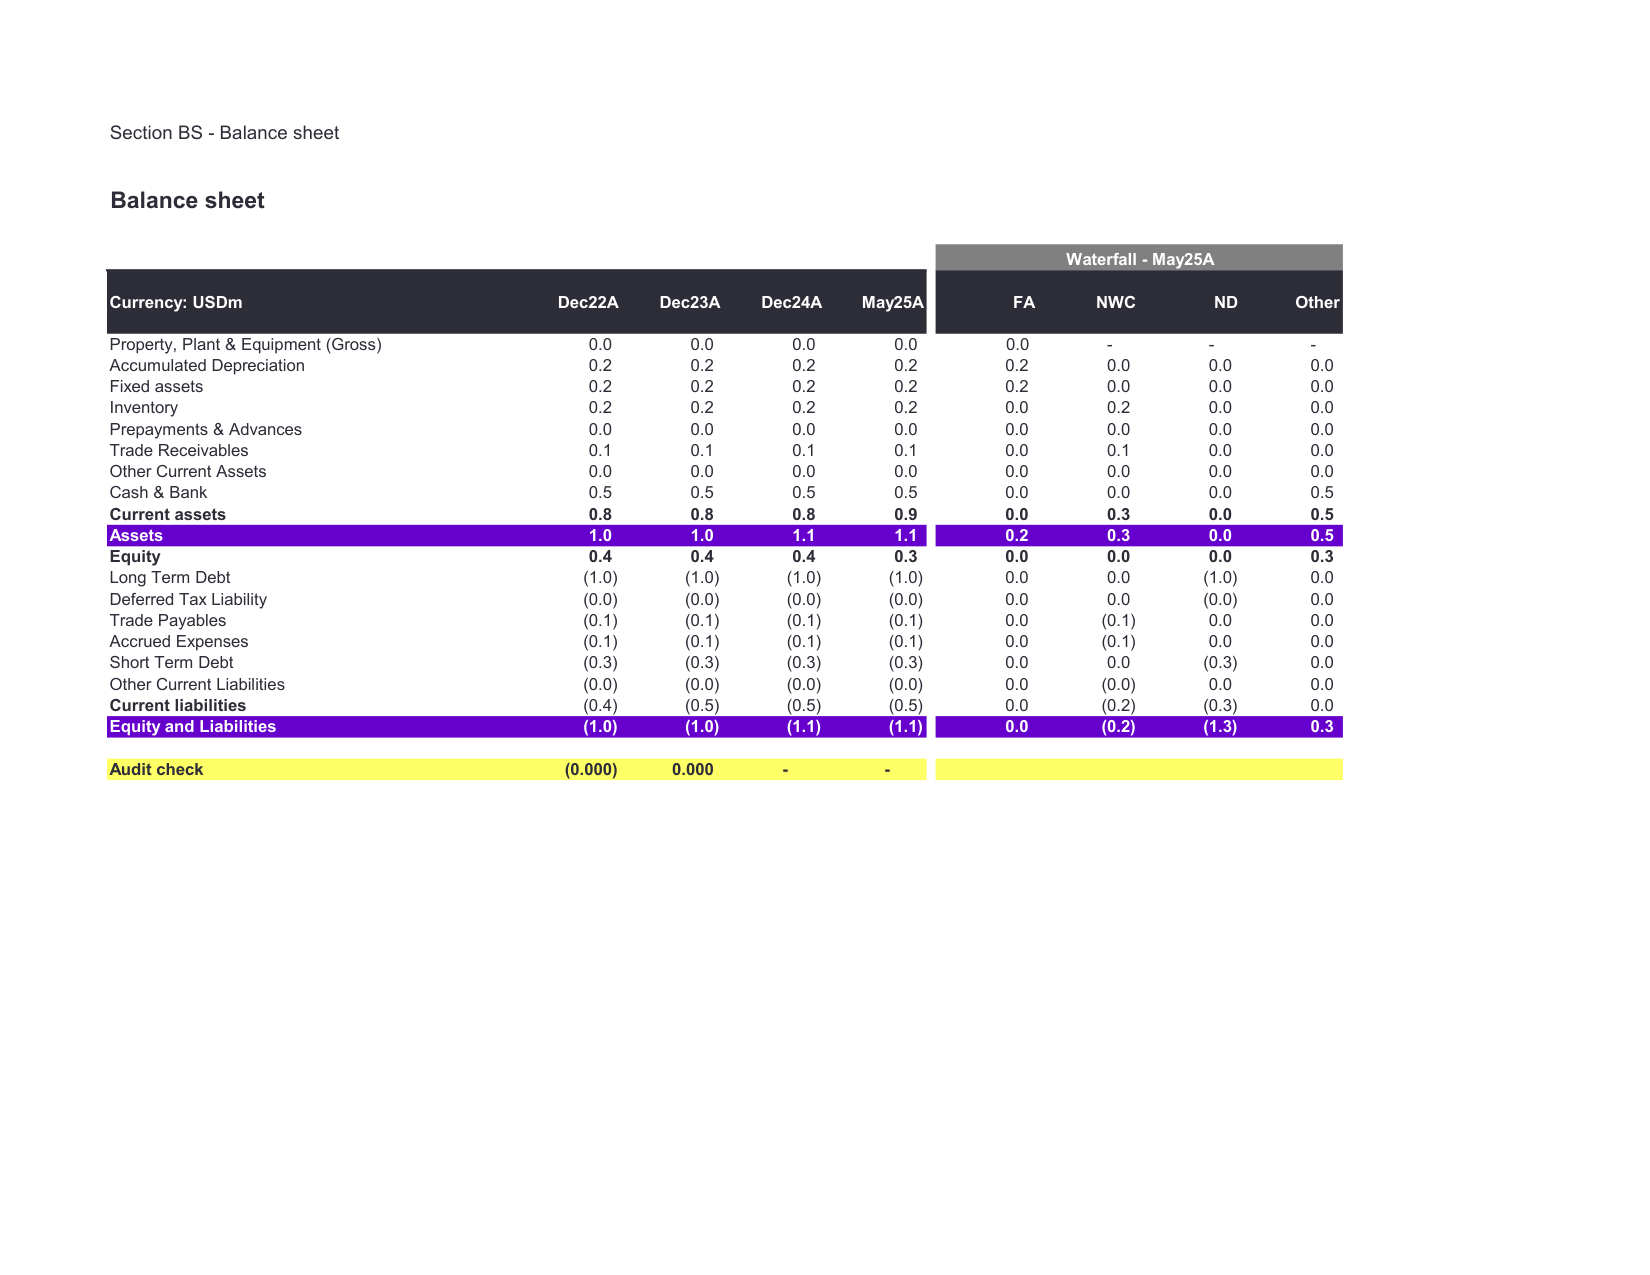
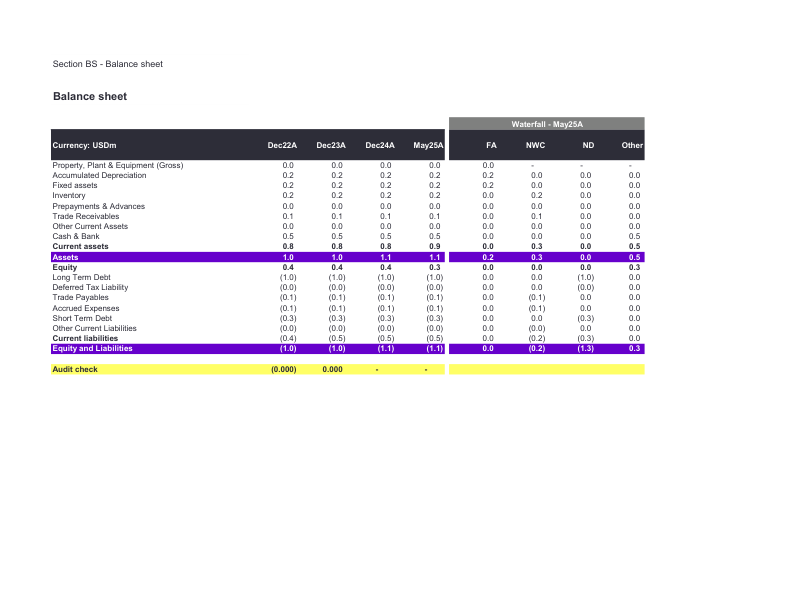
Balance sheet & waterfall
The balance sheet reorganised the way a deal team reads it — fixed assets, working capital, net debt and other, rather than statutory presentation order.
- Four balance sheet dates: Dec22A, Dec23A, Dec24A, May25A
- Waterfall view splitting the balance sheet into FA / NWC / ND / Other
- Gross and net presentation for property, plant and equipment
- Sets up the bridge between enterprise value and equity value
Page 19 · BS — Balance sheet — click to enlarge
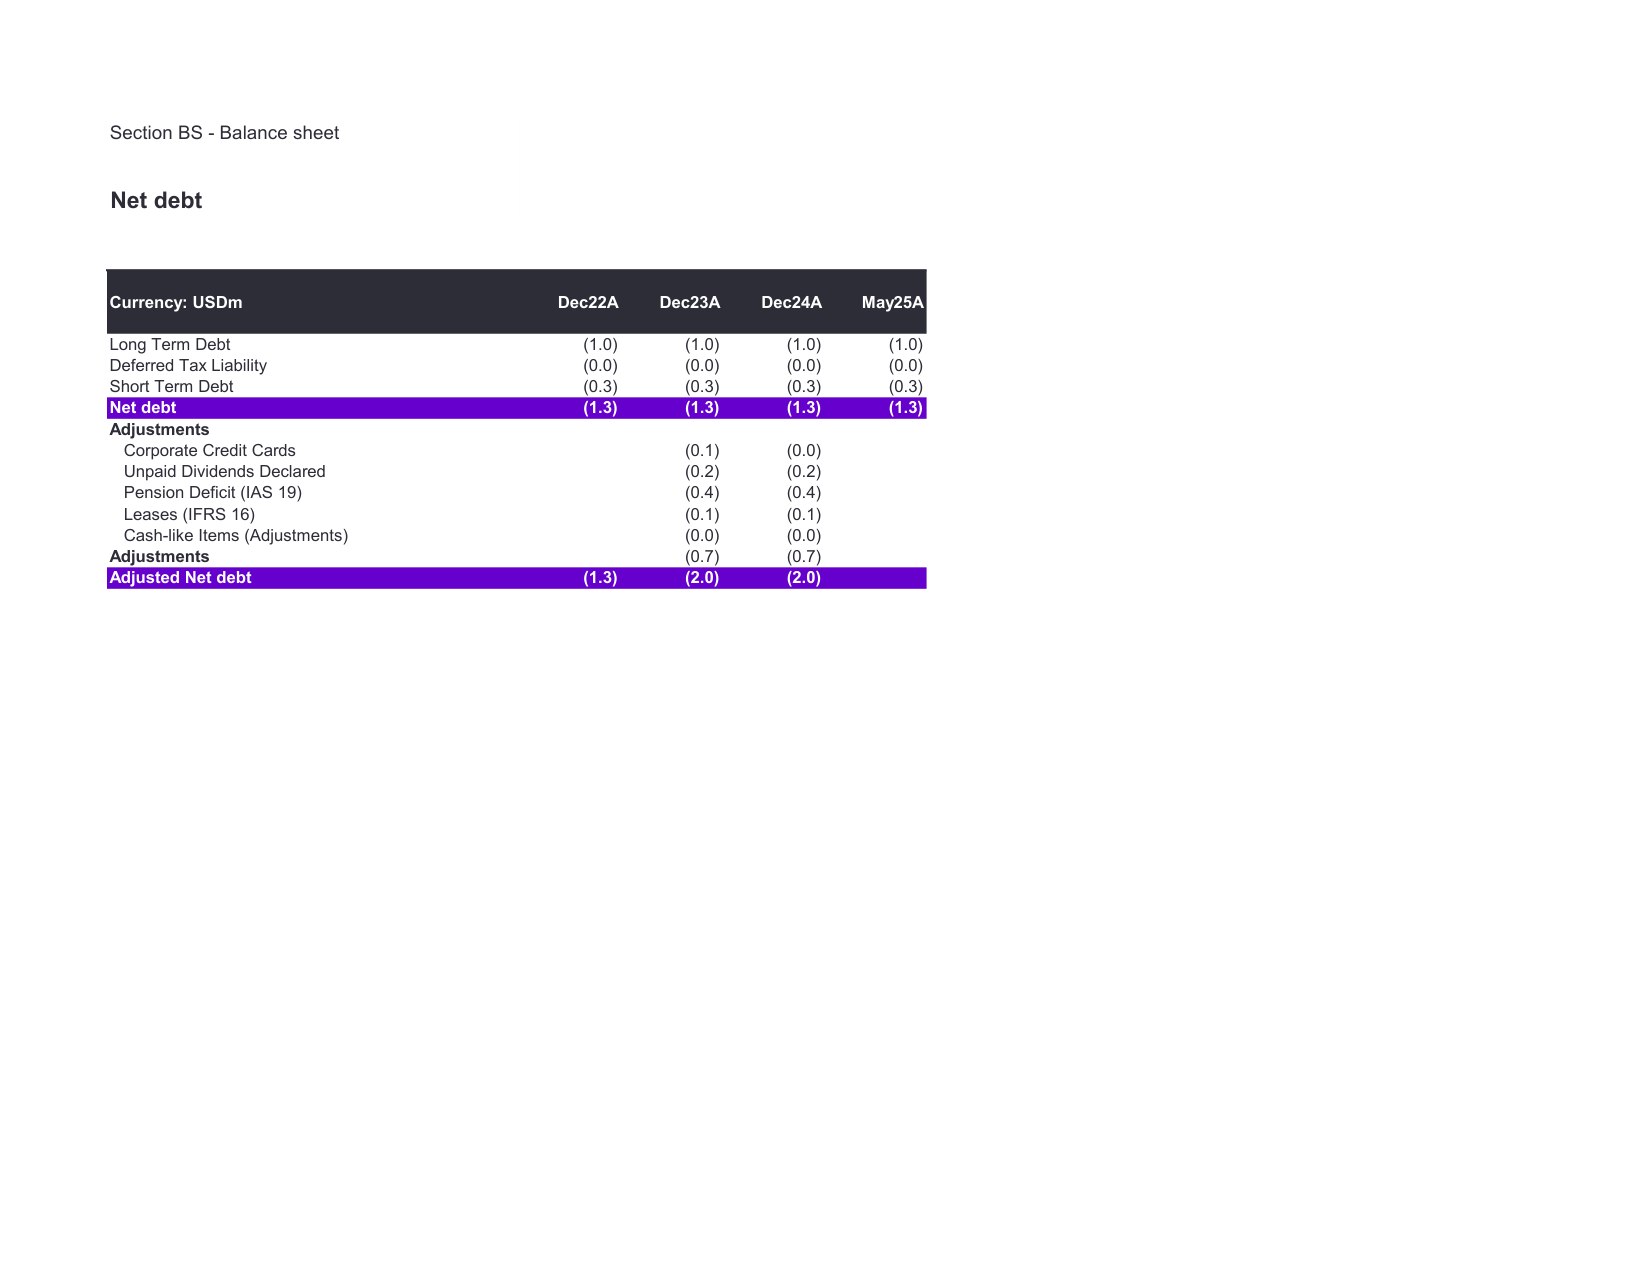
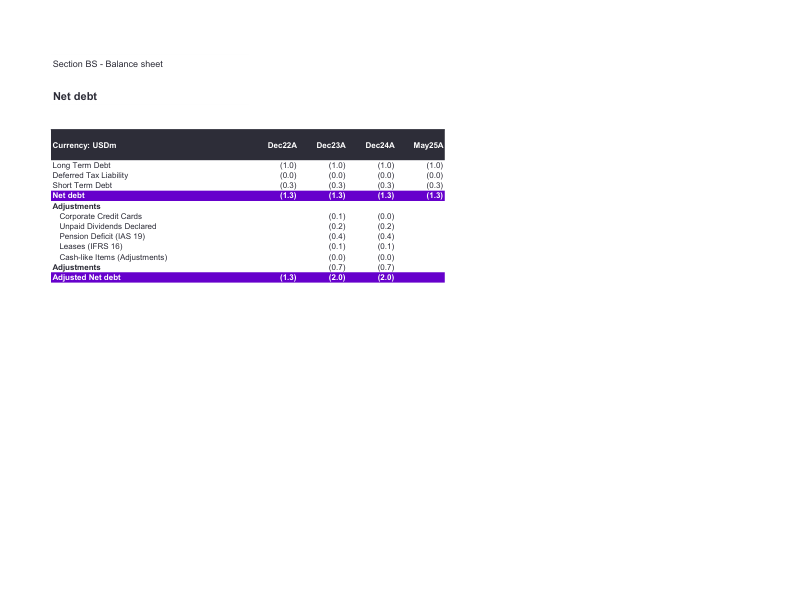
Net debt & debt-like items
What counts as debt is a negotiation, not a given. This page separates reported net debt from the items a buyer will argue belong in it.
- Reported net debt — long-term debt, short-term debt, deferred tax
- Debt-like adjustments itemised: unpaid declared dividends, pension deficit (IAS 19), leases (IFRS 16), corporate credit cards
- Cash-like items identified separately
- Reported net debt of (1.3) becomes adjusted net debt of (2.0) — a difference that comes straight off equity value
Page 24 · WC — Working capital — click to enlarge
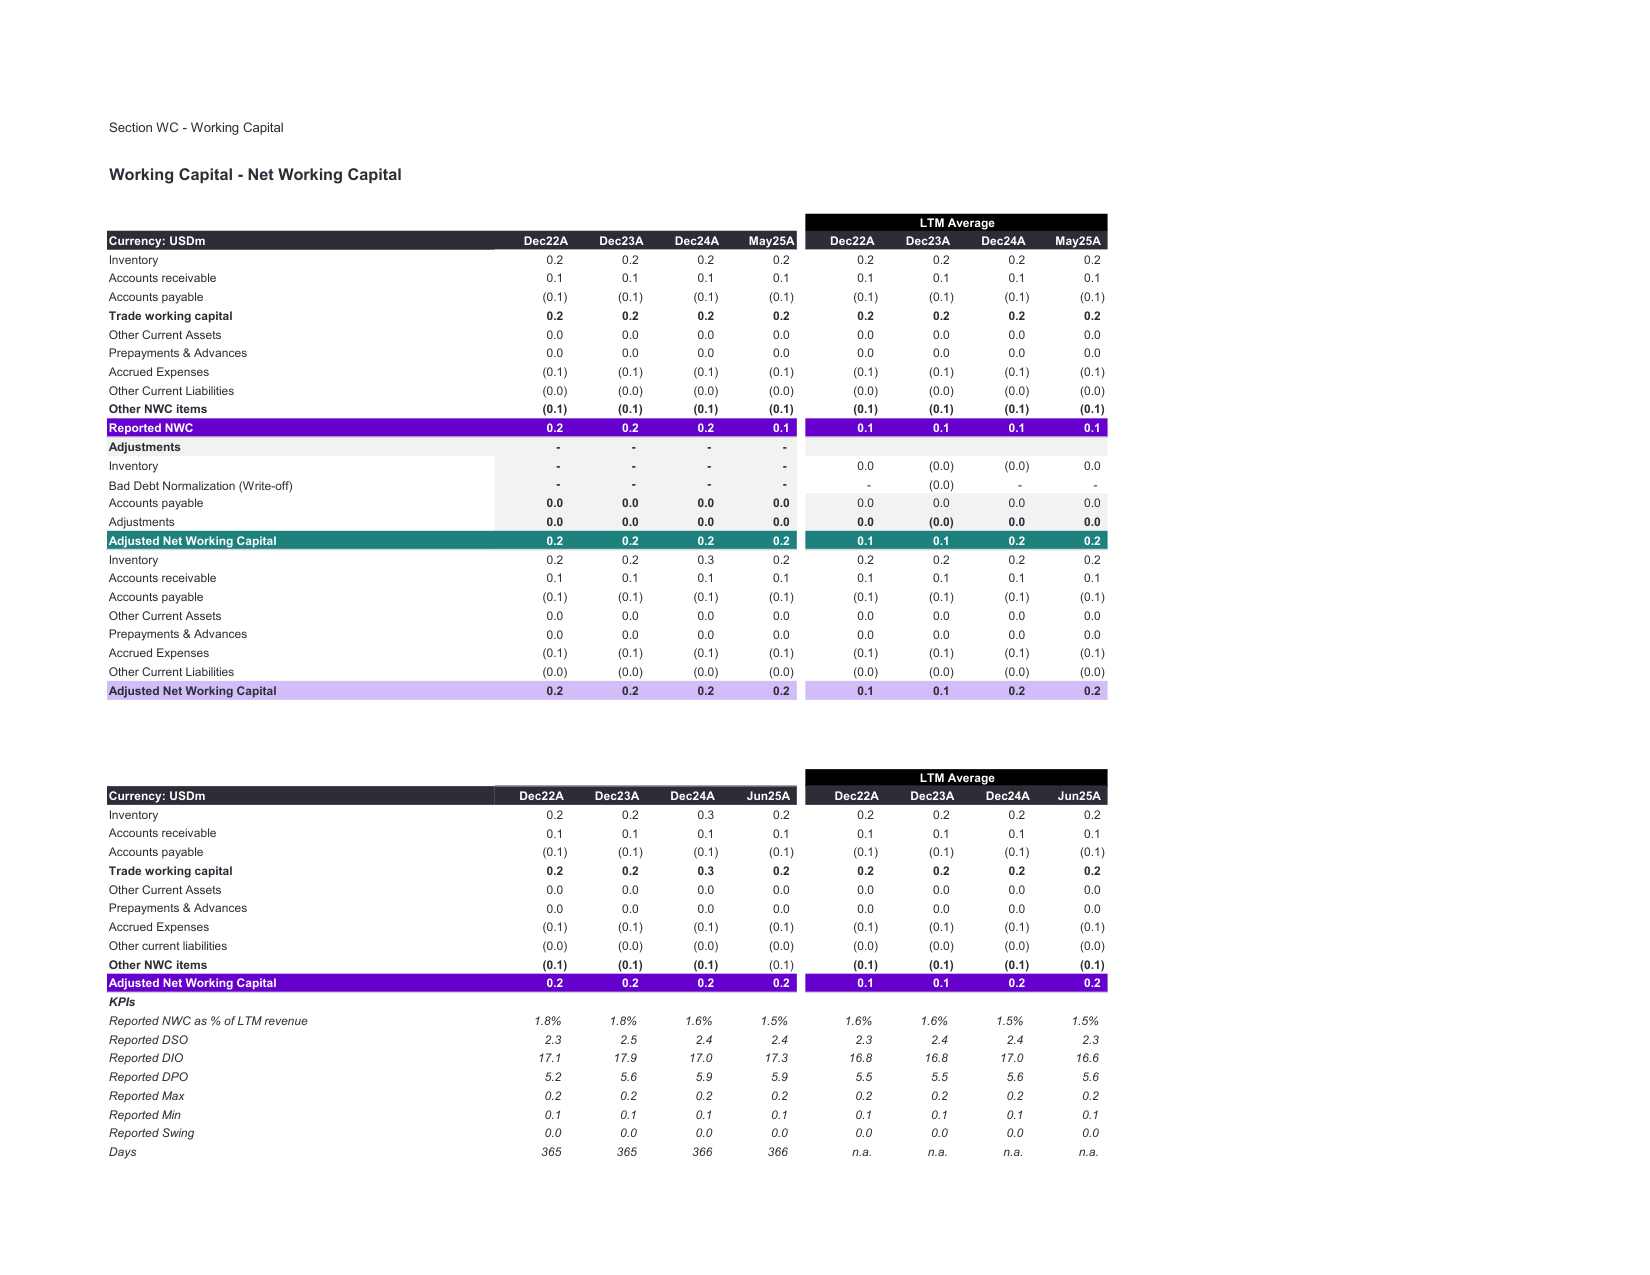
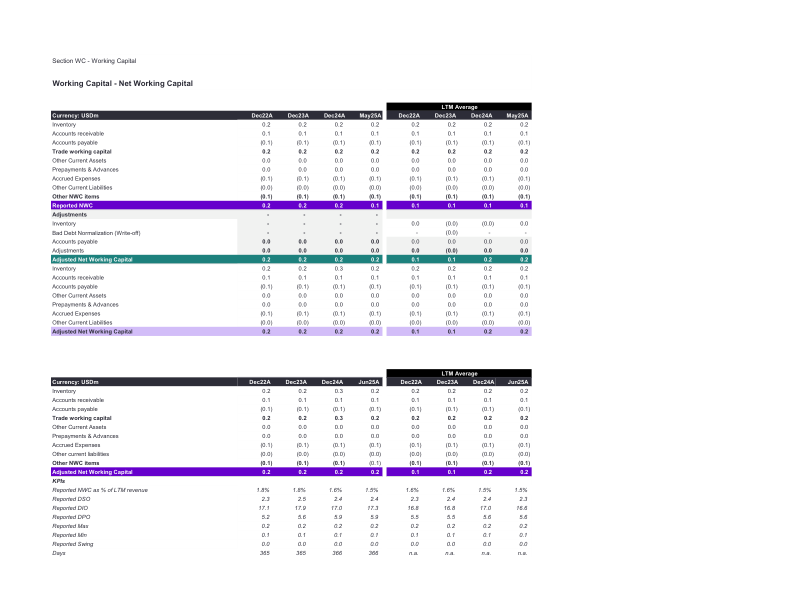
Net working capital & peg
Working capital is the most common source of post-completion dispute. This page shows both the period-end position and the LTM average that a peg is normally set from.
- Every component tagged by type — inventory, receivables, payables, accruals, other
- Period-end and LTM average side by side — the peg is set on the average, not the snapshot
- Adjustments schedule: one-off stock build, obsolete stock provision, bad debt normalisation, stretched creditors, bonus accrual smoothing
- Reported NWC walked to adjusted NWC, which is the figure that goes into the SPA
Page 23 · CF — Cash flow — click to enlarge
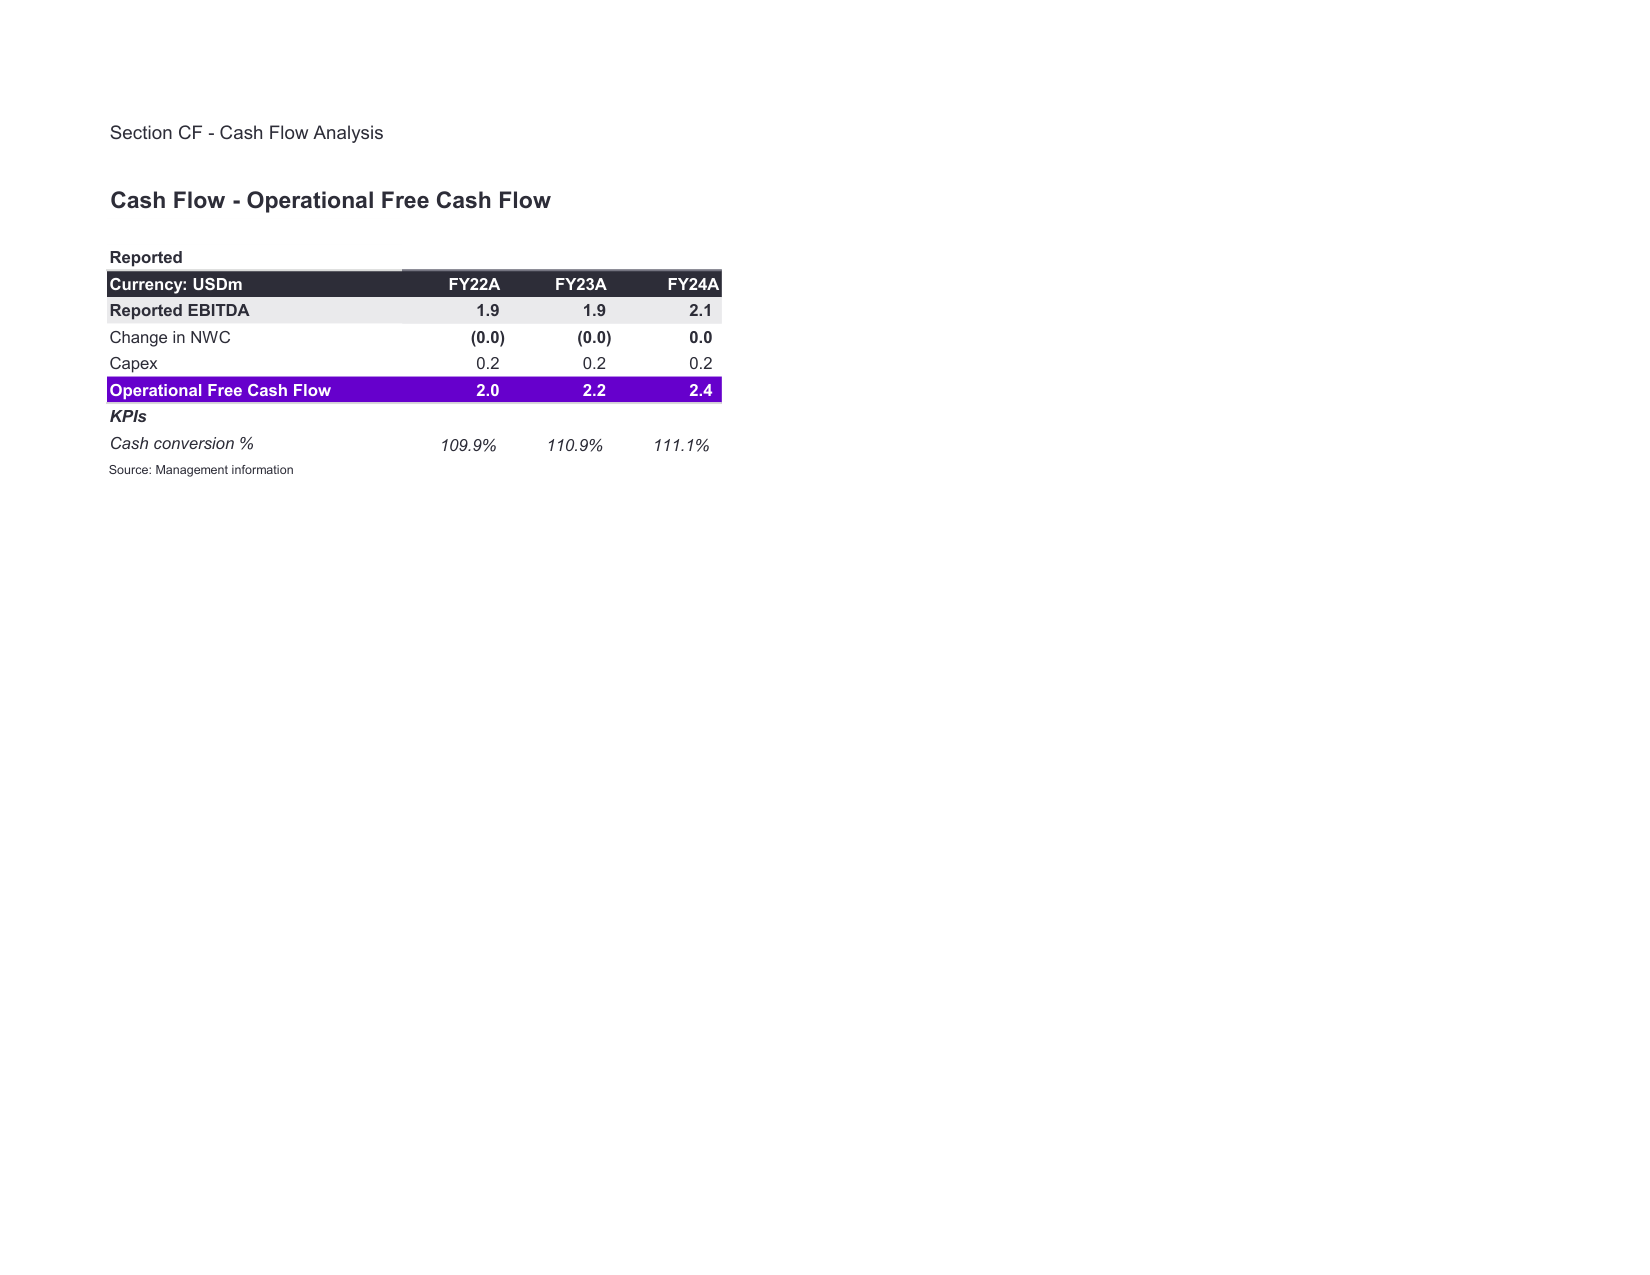
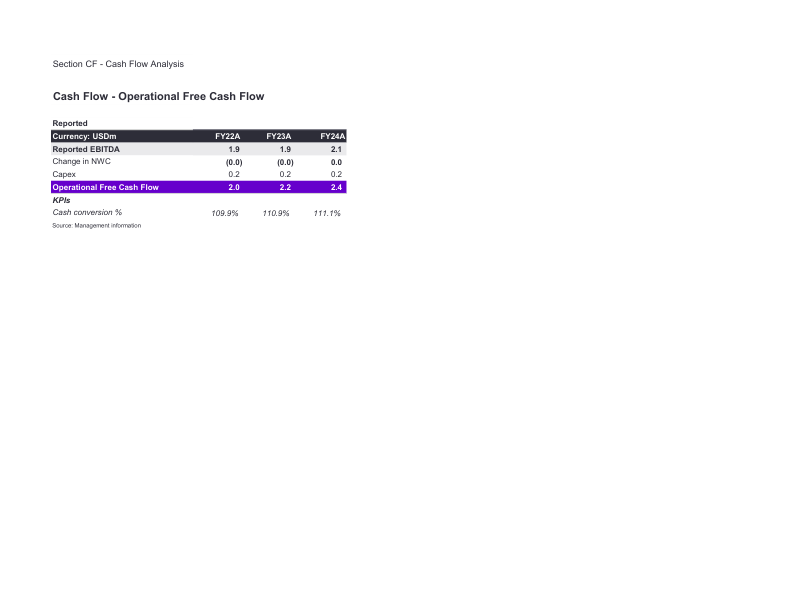
Operational free cash flow
How much of reported EBITDA actually converts to cash — the test of whether earnings are real.
- Reported EBITDA walked down to operational free cash flow
- Change in net working capital shown as a cash movement
- Capital expenditure split maintenance versus growth where the data supports it
- Cash conversion percentage, which appears in the executive summary KPI table